Simulation, data analysis
Automating Data Entry for Balancing Power Supply and Demand
Overview
Power business handles huge amounts of data when balancing the supply and demand and rading. We are actively working to automate the data linkage in order to make data compilation more efficient and prevent errors.
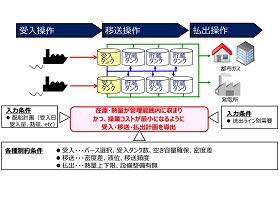
Application Example at Power Supply and Demand Systems
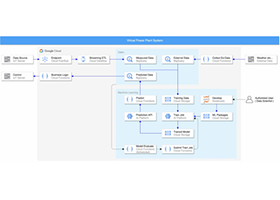
We use an Power supply and demand system to calculate the balance of power supply and demand in each 30 minutes. To make this calculation, retail and wholesale volumes on the demand side and renewable energy and thermal power generation volumes and wholesale procurement volumes on the supply side must be collected from various data sources in each area, customer and 30 minutes. Then these data is entered into the power supply and demand system.
By creating a system that can automatically input data into this power supply and demand system, we have achieved significant efficiency improvements.

Power supply and demand system overview
Example of details
As an example, the forecasting of renewable energy power generation is explained below. Because the format of this power generation forecast data differed from the data input format of Osaka Gas's power supply and demand system, the data had to be processed and manually linked to the power supply and demand system. In addition, the number of power generation was large and processing the date took a lot of time.
By utilizing VBA and other tools, we were able to automate the entire process, from data acquisition to registration, thereby achieving significant workload reduction.
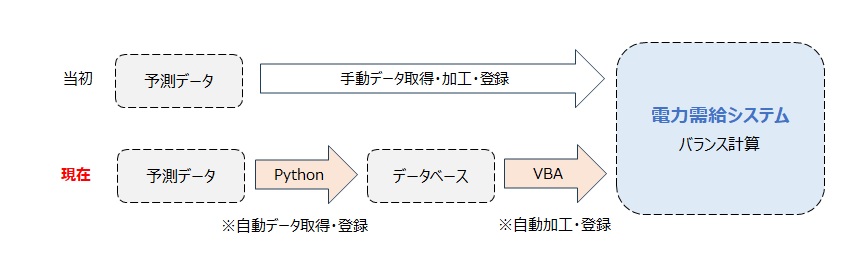
Flow of renewable power generation forecast data.
Conclusion
While there are many data sources that cannot be automatically linked to the power supply and demand system, we are using various tools such as Python, VBA, and RPA to achieve smooth data aggregation and improve efficiency.
Related contents
TAG SEARCH
- Evolving residential gas appliances
- Evolving residential gas appliances Water heaters, space heaters, dryers Cooking appliances Smart Equipment Fuel Cell systems
- Evolving commercial and industrial gas appliances
- Evolving commercial and industrial gas appliances Cogeneration (CHP) units Air conditioning systems, kitchen appliances Bio, water treatment Industrial furnaces, burners Energy management, IoT
- Enhancing the safety and economic efficiency of LNG regasification
- Enhancing the safety and economic efficiency of LNG regasification Utilization of cold energy Plant materials Power generation technology
- Developing next-generation businesses through enterprising initiatives
- Developing next-generation businesses through enterprising initiatives Materials development Measurement Simulation, data analysis Food science Material evaluation
- Contributing to conserving the environment and achieving a carbon neutral society
- Contributing to conserving the environment and achieving a carbon neutral society Methanation Hydrogen, ammonia Biogas Energy management Renewable Energy
- Technologies of Group companies
- KRI, Inc. Osaka Gas Chemicals Group OGIS-RI Group